


Recent technological advances are giving rise to novel tests of visual function. Diagnostic testing with portable, inexpensive devices now enables the evaluation of patient populations with limited access to health care and permits testing outside the clinical setting or at home. These changes allow more active monitoring of patients, increase the quantity of results, and can provide more timely information on the efficacy of current treatment and potential changes in visual status. Specifically, visual acuity, contrast sensitivity, color vision, binocularity, and other functional vision characteristics can be readily tested outside of conventional clinic appointments.
Visual field testing is used to detect and monitor visual impairment related to glaucoma, macular disorders, and neuro-ophthalmic conditions. This article provides an overview of the use of tablet displays, virtual reality (VR) headsets (see Virtual Reality Headsets), and internet-based procedures for performing visual field testing.
HISTORY
Eye care providers have evaluated the peripheral visual field for more than 2,000 years, with procedures performed manually until fairly recently.1 About 45 years ago, Franz Fankhauser, MD, developed the Octopus 201 perimeter (Haag-Streit). This device provided an automated method for eye care providers to conduct this method of testing.2-6 Since then, a number of automated perimeters have been developed, and this technology has become a mainstay for the assessment of peripheral visual field loss related to various ocular and neurologic disorders. Most of the currently available devices are expensive and not easily portable, and they must be operated by trained personnel. This presents obstacles to using them in developing countries, establishing vision-screening procedures, and enabling patients to perform testing outside of an eye care facility. Recent technological advances make it feasible to use tablet displays, VR headsets, and websites to perform quantitative visual field testing and other visual function procedures.7-22
VISUAL FIELD SCREENING PROCEDURES
Available as an app that is free to download, visualFields Easy (VFE; George Kong softwares) allows a perimetric screening procedure to be performed with an iPad tablet placed 33 cm from the observer. The VFE software presents a standard background intensity of 10 cd/m2 (31.5 apostilbs) and Goldmann size V targets at an intensity of 16 dB. Testing is monocular; a best-corrected distance refraction (with or without a bifocal add) is put in place for the eye being tested, and an opaque eye patch is placed in front of the contralateral eye. A red fixation point is presented in the lower left corner of the tablet, and 24 target locations are presented within the upper right visual field quadrant. When this portion of the test is complete, the fixation point moves to the lower right corner, and the upper left visual field is evaluated with 24 test locations. The process continues until all four visual field quadrants have been tested. The observer can respond either by pressing on the screen (not recommended) or by pressing a connected USB response button (Figure 1). Catch trials are also presented to monitor false-positive and false-negative responses.

Figure 1. A participant performs the VFE screening test on an iPad.
As part of a screening program to detect glaucoma and diabetic retinopathy, the VFE test was performed on more than 400 eyes in Nepal. For comparison, more than 95% of the eyes also underwent Humphrey Field Analyzer (HFA, Carl Zeiss Meditec) 24-2 Swedish Interactive Threshold Algorithm (SITA) Standard tests.16 In addition, nonmydriatic photographs of the optic disc and retinal nerve fiber layer were obtained that were evaluated by two fellowship-trained glaucoma specialists. Some of the participants had not previously received a thorough eye examination or medical evaluation, but all of them underwent a complete examination by a fellowship-trained glaucoma specialist for this investigation.
There was a significant correlation between the number of missed locations on the VFE test and mean deviation (MD, r = 0.79, P < .0001) and pattern standard deviation (r = 0.60, P < .0001). There was also a good correlation between the percentage of missed test locations on the VFE and the percentage of abnormal locations on the HFA 24-2 total deviation plot (r = 0.51, P < .0001) and pattern deviation (PD) plot (r = 0.68, P < .0001). The VFE test took an average of 3 minutes, 18 seconds to complete, and it had a higher false-positive rate than the HFA, probably because locations that were missed initially were not retested. Overall, the VFE visual field screening program performed very well. Figure 2 shows an example of the VFE presentation pattern (A) and test results in comparison to the HFA 24-2 test for the left (B) and right (C) eyes of two patients with moderate glaucomatous visual field loss.
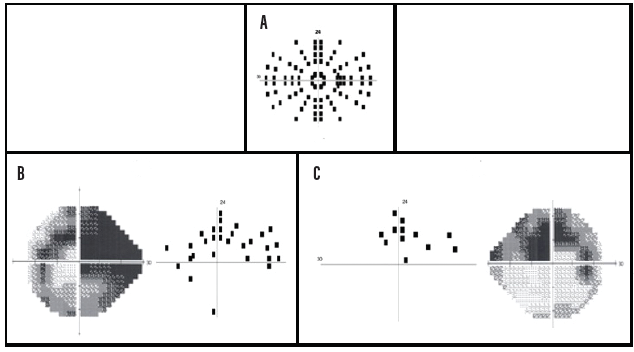
Figure 2. A representation of the 96 test locations (24 per quadrant for the right eye) of the VFE perimetric screening procedure (A). Left eye test results for a patient with a superior arcuate deficit and a partial inferior arcuate defect caused by glaucomatous damage. Dark squares indicate targets that were missed at those locations (B). Right eye test results indicate a superior arcuate scotoma in a patient with moderate glaucomatous visual field loss. Dark squares indicate targets that were not detected at those locations (C).
Courtesy of Swati Upadhyaya, DO, DNB
QUANTITATIVE VISUAL FIELD TESTS
The Melbourne Rapid Fields (MRF; M&S Technologies) procedure was developed to provide a quantitative threshold visual field test that can be performed on a tablet or any visual display system through a website.17-22 MRF uses a Bayesian strategy referred to as Zippy Estimation by Sequential Testing or ZEST that is similar in principle to the SITA algorithm on the HFA. To date, MRF results have been reported to have a high correlation with those produced by the 24-2 SITA Standard test procedure on the HFA, and the MRF procedure appears to be suitable for longitudinal follow-up, bedside evaluations, and testing at home.17-22 The MRF has a more limited range of intensity than the HFA, so the former incorporates larger targets for testing locations at greater eccentricities. For this reason, the sensitivity profile of the central 30º radius visual field is relatively flat compared to the “hill of vision” that is typically obtained on the HFA for a size III target in a normal eye. By increasing the target size for greater eccentricities, the MRF is able to maintain a dynamic range of approximately 30 dB for the central visual field at all eccentricities. Sensitivities better than 30 dB, however, cannot currently be evaluated; 30 dB is the upper limit. The MRF can perform 24-2, 30-2, and 10-2 tests as well as a rapid screening test.
The MRF test is slightly faster than SITA Standard and slightly slower than SITA Fast. The MRF reportedly has a coefficient of repeatability of 9.6% in normal visual field locations and 48.1% in areas of visual field loss. It is relatively unaffected by moderate changes in testing distance and ambient illumination, but it is modestly influenced by screen reflections, blur, and pupillary miosis.18 The interclass correlation with the HFA for visual field indices was high (MD, 0.93; PD, 0.86), and the test-retest reliability compared to the HFA was 0.93 for MD and 0.89 for PD.18 Figure 3 presents the printed output for the MRF test for patients with early glaucomatous visual field loss (top graph) and moderate glaucomatous damage (bottom graph).
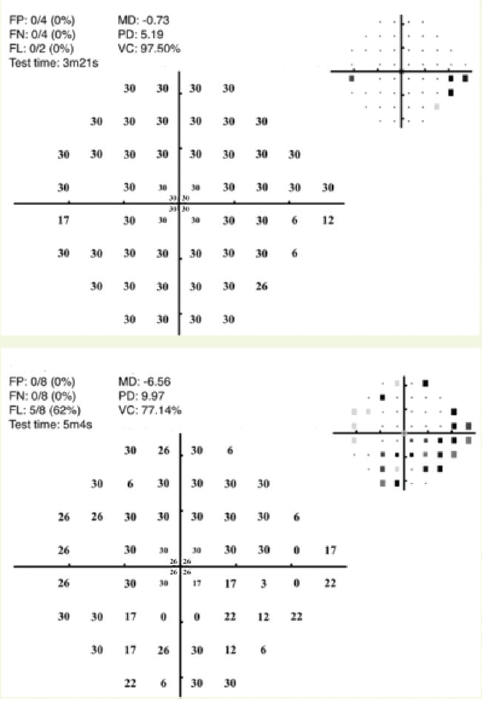
Figure 3. Examples of visual fields obtained with the MRF test for the left eye of a patient with early glaucomatous visual field loss (top graph) and the left eye of a patient with moderate glaucomatous visual field loss (bottom graph).
Courtesy of Algis Vingrys, BSc, PhD, FAAO, FARVO, and George Kong, MBBS, PhD, FRANZCO
CONCLUSION
The VFE and MRF are examples of emerging tablet-, computer-, and internet-based diagnostic procedures. Peristat (KeepYourSight) is another example. Many other approaches have been introduced, suggesting that a new era in visual field testing is dawning.16-22 VR headsets can provide the additional advantages of standardizing test distance and minimizing the influence of head movements. The availability of portable, inexpensive, battery-operated devices that can interface with telemedicine programs should be tremendously beneficial for vision testing in developing countries. Similarly, the ability to conduct these tests in a waiting room or other area before a patient is seen by an eye care specialist should enhance the efficiency and cost-effectiveness of diagnostic testing and provide useful information to the practitioner. Home testing could facilitate the detection of changes in visual field status and improve treatment efficiency.
1. Johnson CA, Wall M, Thompson HS. A history of perimetry and visual field testing. Optom Vis Sci. 2011;88(1):E8-15.
2. Fankhauser F, Koch P, Roulier A. On automation of perimetry. Albrecht Von Graefes Arch Klin Exp Ophthalmol. 1972;184(2):126-150.
3. Koch P, Roulier A, Fankhauser F. Perimetry—the information theoretical basis for its automation. Vision Res. 1972;12(10):1619-1630.
4. Bebie H, Fankhauser F, Spahr J. Static perimetry: strategies. Acta Ophthalmol (Copenh). 1976;54(3):325-328.
5. Bebie H, Fankhauser F, Spahr J. Static perimetry: accuracy and fluctuations. Acta Ophthalmol (Copenh). 1976;54(3):338-348.
6. Fankhauser F. Developmental milestones of automatic perimetry. In: Henkind, ed. ACTA:XXIV International Congress of Ophthalmology Proceedings, Part Three—Perimetry and Automatic Visual Fields. Lippincott; 1982:147-150.
7. Han X, Scheetz J, Keel S, et al. Development and validation of a smartphone-based visual acuity test (vision at home). Transl Vis Sci Technol. 2019;8(4):27.
8. Aslam TM, Parry NR, Murray IJ, et. al. Development and testing of an automated computer tablet-based method for self-testing of high and low contrast near visual acuity in ophthalmic patients. Graefes Arch Clin Exp Ophthalmol. 2016;254(5):891-899.
9. Dorr M, Lesmes LA, Lu ZL, Bex PJ. Rapid and reliable assessment of the contrast sensitivity function on an iPad. Invest Ophthalmol Vis Sci. 2013;54(12):7266-7273.
10. Tsapakis S, Papaconstantinou D, Diagourtas A, et al. Home-based visual field test for glaucoma screening comparison with Humphrey perimeter. Clin Ophthalmol. 2018;12:2597-2606.
11. Wroblewski D, Francis BA, Sadun A, Vakili G, Chopra V. Testing of visual field with virtual reality goggles in manual and visual grasp modes. Biomed Res Int. 2014;2014:206082.
12. Mees L, Upadhyaya S, Kumar P, et al. Validation of a head-mounted virtual reality visual field screening device. J Glaucoma. 2020;29(2):86-91.
13. Sircar T, Mishra A, Bopardikar A, Tiwari VN. GearVision: smartphone based head mounted perimeter for detection of visual field defects. Conf Proc IEEE Eng Med Biol Soc. 2018;2018:5402-5405.
14. Hollander DA, Volpe NJ, Moster ML, et al. Use of a portable head mounted perimetry system to assess bedside visual fields. Br J Ophthalmol. 2000;84(10):1185-1190.
15. Matsumoto C, Yamao S, Nomoto H, et al. Visual field testing with head-mounted perimeter ‘imo.’ PloS One. 2016;11(8):e0161974.
16. Johnson CA, Thapa S, Kong YXG, Robin AL. Performance of an iPad application to detect moderate and advanced visual field loss in Nepal. Am J Ophthalmol. 2017;182:147-154.
17. Vingrys AJ, Healey JK, Liew S, et al. Validation of a tablet as a tangent perimeter. Transl Vis Sci Technol. 2016;5(4):3.
18. Kong YXG, He M, Crowston JG, Vingrys AJ. A comparison of perimetric results from a tablet perimeter and Humphrey Field Analyzer in glaucoma patients. Transl Vis Sci Technol. 2016;5(6):2.
19. Nesaratnam N, Thomas PBM, Kirollos R, Vingrys AJ, Kong GYX, Martin KR. Tablets at the bedside – iPad-based visual field test used in the diagnosis of intrasellar haemangiopericytoma: a case report. BMC Ophthalmol. 2017:17(1):53.
20. Prea SM, Kong YXG, Mehta A, et al. Six-month longitudinal comparison of a portable tablet perimeter with the Humphrey Field Analyzer. Am J Ophthalmol. 2018;190:9-16.
21. Anderson AJ, Bedggood PA, Kong YXG, Martin KR, Vingrys AJ. Can home monitoring allow earlier detection of rapid visual field progression in glaucoma? Ophthalmology. 2017;124(12):1735-1742.
22. Schulz AM, Graham EC, You Y, Klistorner A, Graham SL. Performance of iPad-based threshold perimetry in glaucoma and controls. Clin Exp Ophthalmol. 2018;46(4):346-355.
