

Early glaucoma progression has no symptoms. Thus, the burden is on the eye practitioner first to diagnose and then to monitor the disease over time.
Although the concept of a target intraocular pressure (IOP) is useful when therapy is initiated, over time the question of IOP control is better addressed by monitoring the structure of the optic nerve, retinal nerve fiber layer (RNFL), and macula and by performing perimetry (both 24-2 and 10-2). If those test results remain stable over time, the patient is probably at or near a reasonable target IOP. Still, if we watch carefully, most individuals eventually show measureable progression. The doctor’s task is to limit the amount of glaucomatous change and to minimize the chance of visual disability in the patient’s expected lifetime.
DEVICES TO MONITOR PROGRESSION
Multiple modalities, including visual fields, photographs, and OCT, are needed to follow individuals with glaucoma over time. How best to detect glaucomatous progression depends on a host of factors, including the stage of the disease, the clarity of the media, test artifacts, and the patient’s ability and willingness to perform perimetry testing. An example of an artifact on optical coherence tomography (OCT), for example, might be an epiretinal membrane elevating the retinal surface, making thickness measurements appear thicker and potentially masking glaucomatous progression.
State-of-the-art OCT devices are able to detect early glaucomatous progression but frequently miss further loss in areas that have already undergone extensive structural damage. This phenomenon is commonly referred to as the floor effect (Figure 1). In moderate to severe glaucoma, linear regression analysis of OCT mean RNFL thickness will likely show no change, even in progressing patients, potentially masking disease progression.
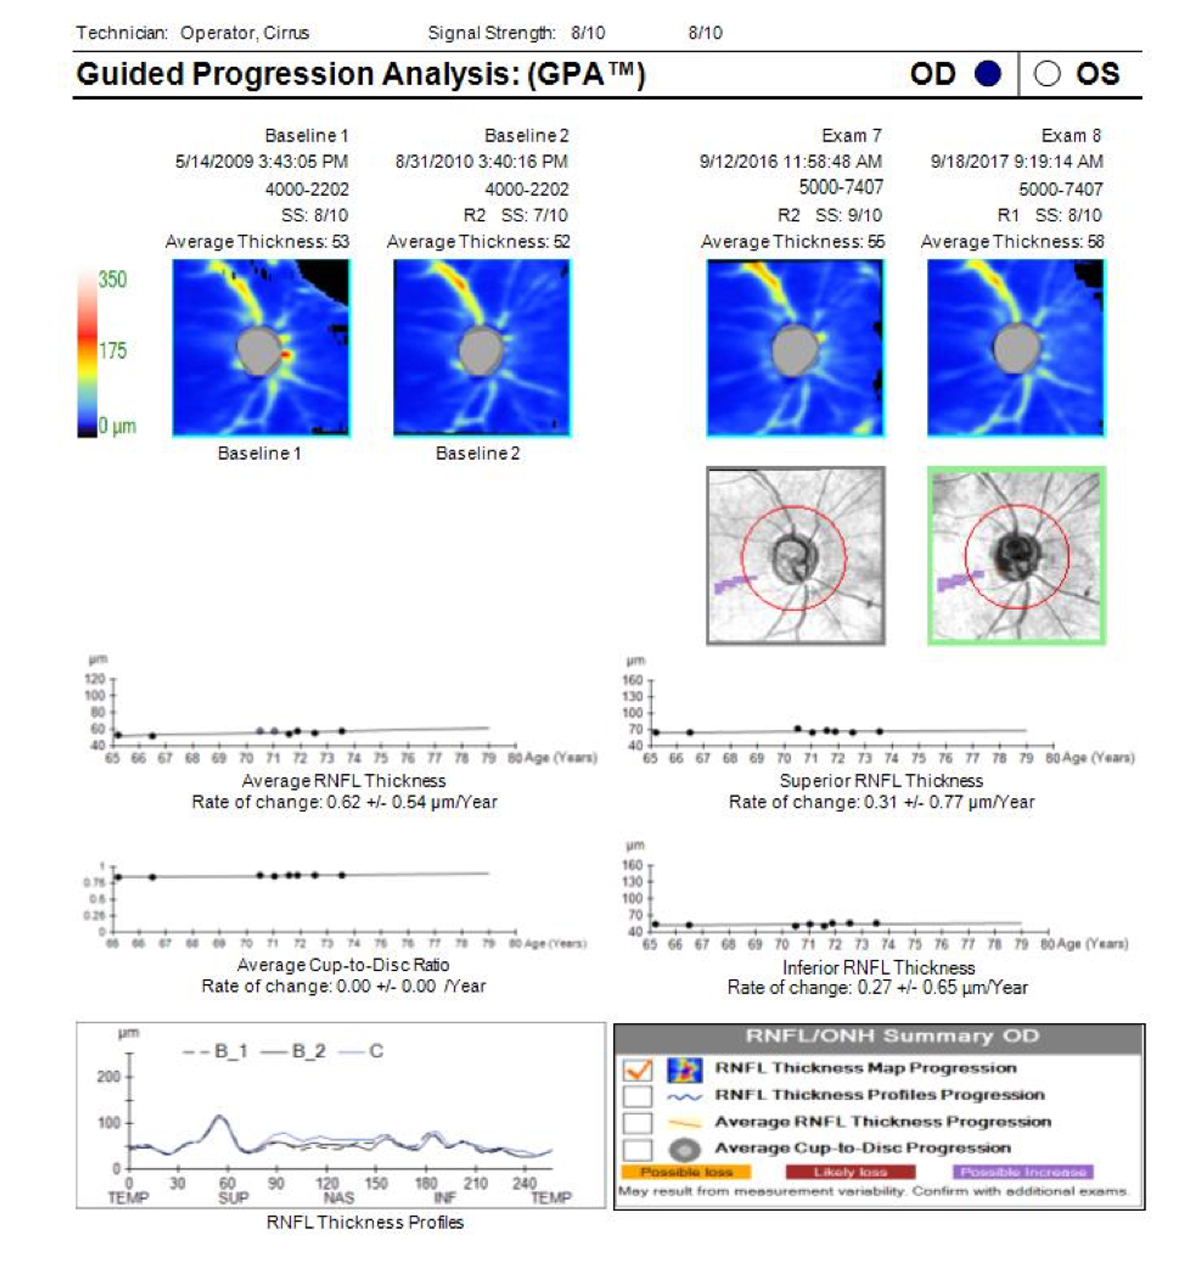
Figure 1. Guided Progression Analysis (GPA) page (Cirrus OCT; Carl Zeiss Meditec) for an individual with advanced primary open-angle glaucoma shows that trend lines for average RNFL thickness, superior RNFL thickness, and inferior RNFL thickness are flat and have hit the floor. This person still has some remaining visual field, so field testing will be needed to monitor for further changes though OCT GCC+ may possibly reveal changes. The OCT trend lines will not go lower than current measurements.
Visual field progression analysis is generally more useful than OCT for following moderate to advanced glaucoma.1 OCT scans of the macular ganglion cell complex (GCC) may allow detection of change in more severe forms of glaucoma.2
WHICH ALGORITHM?
SITA Standard 24-2 perimetry has been the most commonly used test in glaucoma management. However, Saunders and colleagues recently showed that there is little difference between SITA Standard and SITA Fast in detecting glaucomatous progression.3
Also recently, Hood et al showed that the 10-2 macular test pattern, which provides 20-test-point spacing (instead of the 60 spacing on the 24-2 test pattern) may detect glaucomatous field loss that falls in between the 24-2 grid spacing.4 Some experts now recommend using the 24-2 as the default test and performing 10-2 testing in addition at least yearly.
CONFIRMING PROGRESSION
Any finding of progression must be confirmed. Confirmation may consist of detecting both structural and functional change in the same location and is accomplished by repeating the test that showed progression. Patients (and technicians) can have a bad day, and fields that appear to have gotten worse may not be repeatable. Variability could be due to early field instability or an unreliable test result. One does not want to modify therapy until progression is confirmed, but if it is confirmed, then therapeutic escalation should be considered.
If progression is confirmed, your assessment of whether or not the change is clinically significant should include looking at the rate of change. The crucial question is whether progression is happening at a rate that suggests elevated likelihood of visual disability during the patient’s expected lifetime. The rate of change can best be measured when five tests are available, but obtaining five tests is a management dilemma, as doing one test per year means that 4 years are needed before a progression analysis is possible. I recommend doing tests (both fields and OCT) at the time of diagnosis and at 6-month intervals.
Once five tests are available, a slope or rate of change can be calculated by most progression analysis programs. Slopes for the visual field mean deviation (MD) exceeding 1.0 dB per year are probably clinically significant and may imply a need to modify therapy (Figure 2).5 In many cases, if the MD slope is less than 0.5 dB per year, the patient can be considered stable, and fields and imaging can be reduced to yearly intervals.
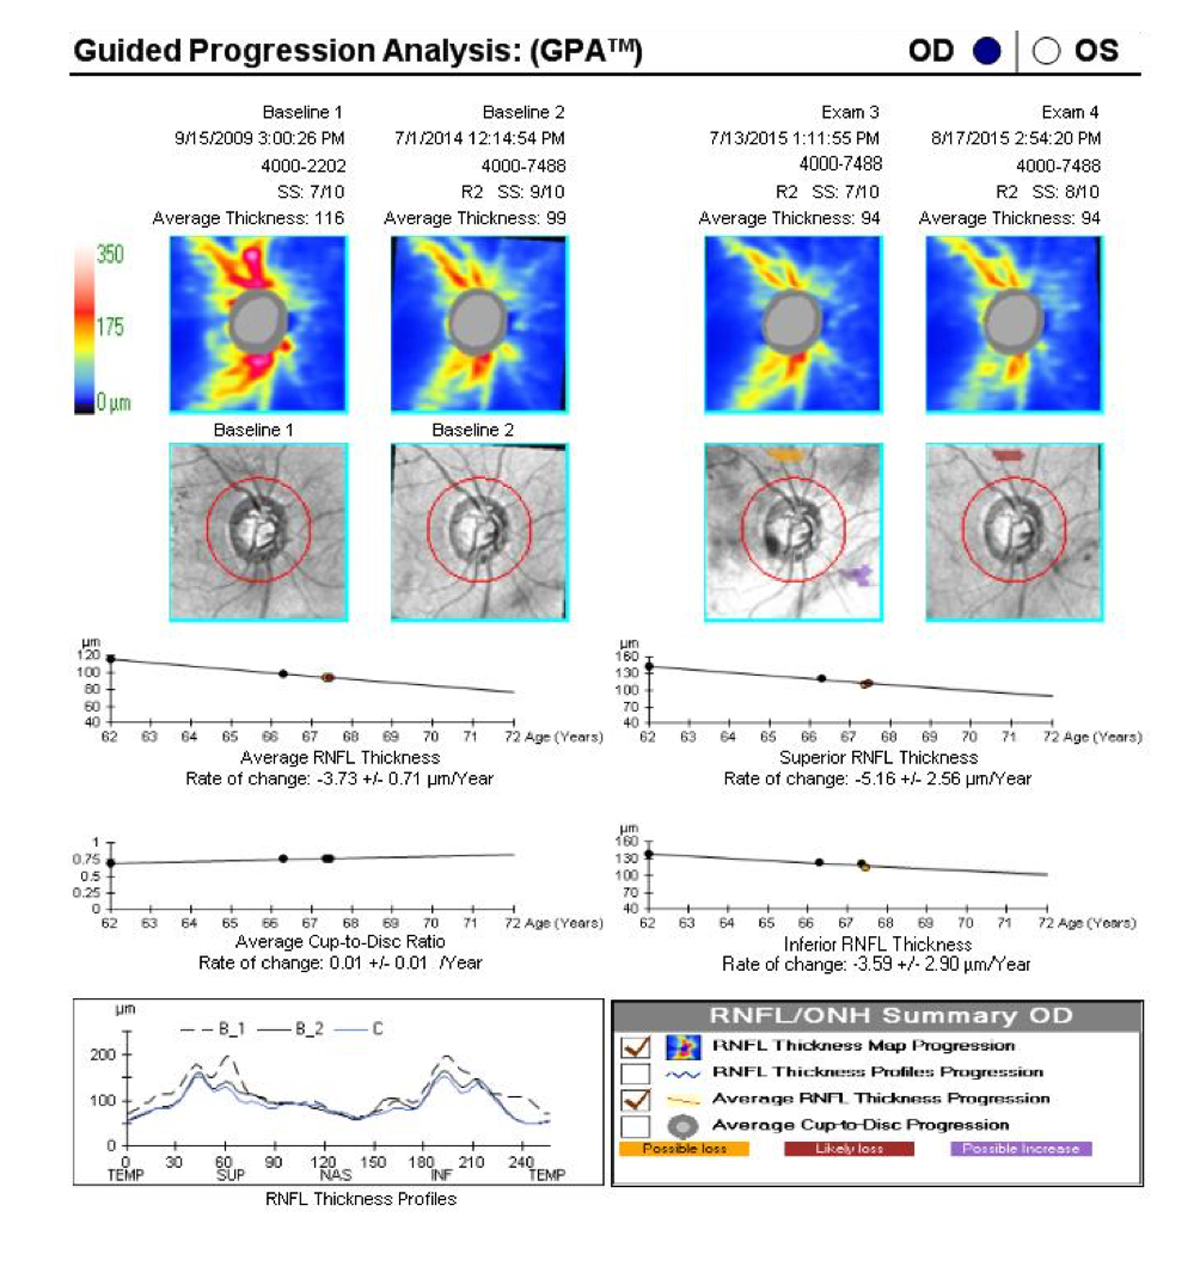
Figure 2. The GPA for this individual with primary open-angle glaucoma shows significant progression, with an average yearly RNFL rate of change of -3.73 µm. Therapy should be modified and the OCT test run periodically until the rate of change decreases and the line flattens.
In evaluating the rate and extent of change, consider the patient’s age and general health. Young healthy individuals with longer life expectancy require more aggressive management than older patients. When the MD approaches -5.0 dB, it is likely that some level of visual disability (eg, reduced reading speed) can be measured, with significant loss when the MD is near -10.0 dB.6
MONITORING THE RNFL
Clinical estimates of cup-to-disc ratio will not detect subtle loss in glaucoma progression.7 In glaucoma suspects and in early glaucoma, OCT scans of the RNFL and GCC are the tests most often used to detect change. Calculation of the rate of change for the TSNIT map (temporal, superior, nasal, inferior, temporal) is available on most OCT platforms, and this is an important metric for assessing the clinical significance of observed progression. In the future, a modified RNFL curve using the NSTIN direction will be available that allows visualization of structure-function correlations and recognition of central involvement.
It is important to know that the 95th percentile for mean RNFL thickness for a normal 70-year-old is approximately 105 µm, and only 5% of normal 70-year-olds have a mean RNFL thickness less than about 75 µm. Findings falling between these two limits will be color-coded green, but multiple steps of statistically significant loss can occur, all while the mean RNFL is still in the green. Thus, a color green does not mean the finding is “normal.”
It is not clear at what level of RNFL thickness someone becomes visually impaired, but we know that visual field loss commonly appears when RNFL thickness approaches 75 µm.8 With this in mind, if a 70-year-old patient is diagnosed with glaucoma has a mean RNFL thickness of 85 µm, further loss as small as 2 µm per year will lead to detectable visual field loss by the time he or she is 75 years old.
What amount of OCT change is considered a statistically significant progression event? Given the high reproducibility of OCT devices, a change in mean RNFL thickness of 5 µm (if confirmed) is indicative of progression.9 Still, this 5-µm change should be considered as occurring within a period of years, not decades, because there is a small amount of RNFL loss related to aging.
CONCLUSION
Monitoring for progression is a crucial part of the management of glaucoma patients and suspects. Using photographs, visual field, and OCT can help us to detect change, modify therapy, and keep our patients seeing throughout their lifetimes.
The author thanks V. Michael Patella, OD, for his review of this manuscript.