

Primary eye care examinations have long relied on the use of a combination of objective refraction results (eg, retinoscopy, autorefraction), subjective refraction results, and medical imaging. In managing a patient’s refractive error, correlation between a patient’s objective and subjective refraction is crucial to determine the patient’s spectacle and contact lens prescriptions and to make decisions regarding refractive surgery. Medical imaging aids in the analysis of the optical pathway (tear film, cornea, iris, crystalline lens, vitreous, retina) to support decision-making in primary eye care examinations.
New imaging and analytic technologies allow clinicians to paint a more complete picture of a patient’s entire optical system. Eye care analytics is the use of data from multiple sources to accomplish this. Elements of eye care analytics include the following:
- wavefront analyzers to provide wavefront refraction data;
- traditional autorefraction data;
- medical imaging (Placido disc topography, pupillometry, retroillumination of the crystalline lens, anterior segment photography, point spread function, etc.);
- axial (anterior) corneal topography;
- optical path difference (OPD) and internal OPD An OPD displays the refractive error distribution within a 9.5 mm diameter in diopters of the entire eye, taking into account the cornea and all internal refractive powers, including the posterior cornea and the crystalline lens. The internal OPD is a display of the internal refractive error measurement within the area ranging from the posterior surface of the cornea to the retina.
The use of both corneal topography and OPD mapping (OPD and internal OPD) can provide additional information in the analysis of astigmatism, keratoconus, pellucid marginal degeneration, and other forms of irregular astigmatism. Automated refraction systems driven by modern wavefront analysis can help clinicians to manage patients’ refractive changes over time. Analysis of the wavefront aberrometry of specific segments of the optical pathway allows assessment of optical quality throughout the visual system and provides increased objective support for diagnostic and therapeutic decisions in primary eye care.
Taken together, the clinical application of these eye care analytics technologies can allow clinicians to achieve a paradigm shift in primary eye care for patients, including the management of refractive error.
PRINCIPLES OF WAVEFRONT ABERROMETRY
In wavefront aberrometry, the deviations of a wavefront passing through a patient’s visual system are compared with the wavefront of an ideal optical system reference standard. The value of modern wavefront analyzers has been enhanced by the integration of corneal and internal topography; this allows analysis of ocular structures from the posterior corneal prism through to the posterior vitreous body.
Modern wavefront aberrometry takes one of three forms. Perhaps the most commonly used in ophthalmology is the Hartmann-Shack wavefront sensor.1The second type is ingoing retinal imaging aberrometry, such as with the Tscherning aberrometer.2The third is ingoing feedback aberrometry, as in the OPD method, in which the phase diference from a central ray to each analysis point peripheral to the central ray is measured and shows the amounts of refractive correction at different analysis points.3
CASE REPORT
In the following case report, a comprehensive view of the optical pathway demonstrates the value of wavefront analysis in a primary care eye exam.
A 47-year-old black man presented with complaints of distance vision blur in both eyes. His visual complaints included monocular diplopia and glare. The patient reported a history of multiple car accidents and facial trauma from work-related encounters and contact sports. His ocular history included bilateral degenerative myopia, a likely traumatic cataract in the right eye, and a subluxated crystalline lens in the left eye. His medical history was negative for Marfan syndrome.
Manifest refraction was -14.25 -5.50 X 30° in the right eye (OD) and -12.75 -2.75 X 175° in the left eye (OS) with CDVA of 20/50 OD and 20/30 OS.
After dilation with 1% tropicamide and 2.5% phenylephrine, mesopic wavefront refraction readings were -17.00 -3.00 X 20° OD and -13.25 -3.00 X 154° OS.
The patient returned to our clinic 20 days later for a contact lens evaluation. At that visit, manifest refraction was -14.25 -2.50 X 180° OD and -11.00 -2.75 X 140° OS. CDVA was 20/50 OD and 20/30 OS. Plus buildup testing at both visits indicated a +1.75 D add in each eye.
Nidek OPD Scan III testing of the right eye revealed decreased myopia and astigmatism in the lower half of the optical pathway, more consistent with the manifest refraction performed at the contact lens evaluation at the second visit (Figure 1). Retroillumination confirmed posterior cortical lenticular changes OD (Figure 2) and subluxation of the crystalline lens OS (Figure 3). The retroillumination findings were supported at slit-lamp evaluation.
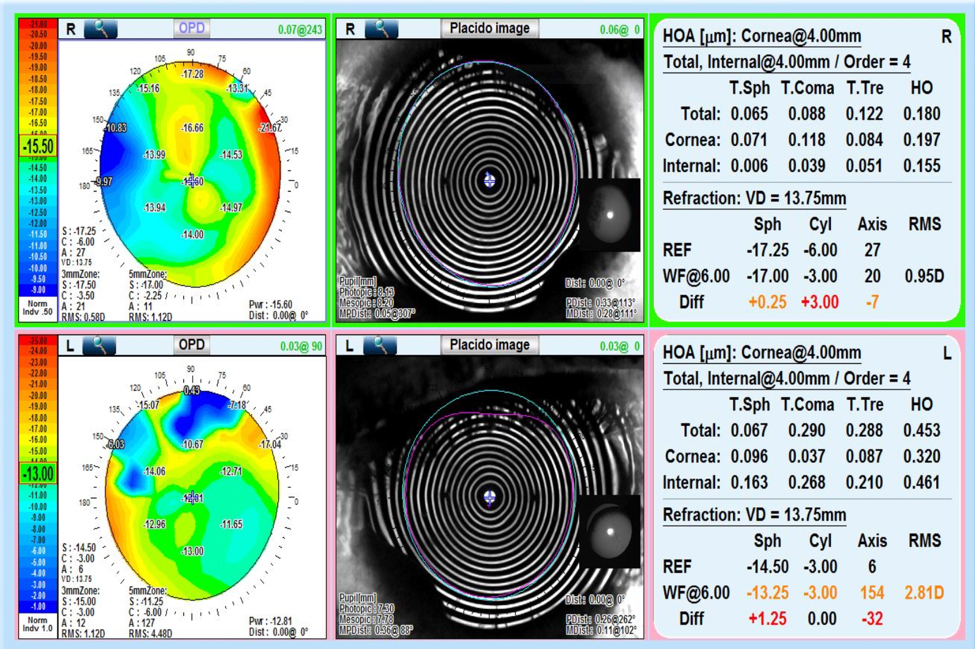
Figure 1. Optical path difference (OPD) aberrometry of the right eye (top) shows decreased myopia and astigmatism in the inferior portion of the optical pathway. OPD aberrometry of the left eye (bottom) shows decreasing myopia as one moves from the 3 mm zone to the more peripheral 5 mm zone; however, astigmatism increases in the 5 mm zone. Placido disc imaging (center) shows good quality tear film in both eyes with good patient fixation. Wavefront refraction data (right) shows a default to the autorefraction in both OD and OS due to large root mean square values: 0.95 OD and 2.81 OS. Larger root mean square values represent decreased optical clarity when patients have good fixation on wavefront analysis.
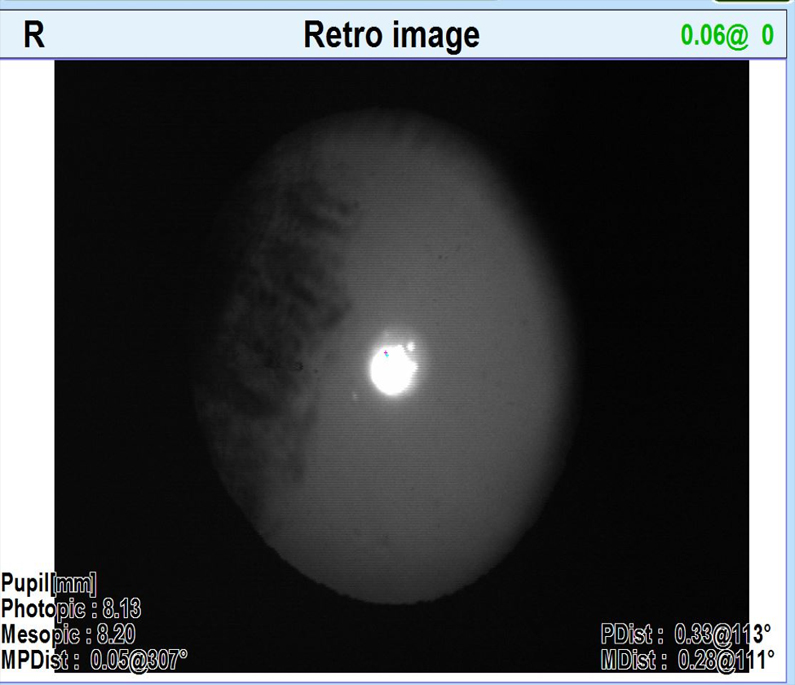
Figure 2. Retroillumination image OD shows a posterior traumatic cataract.
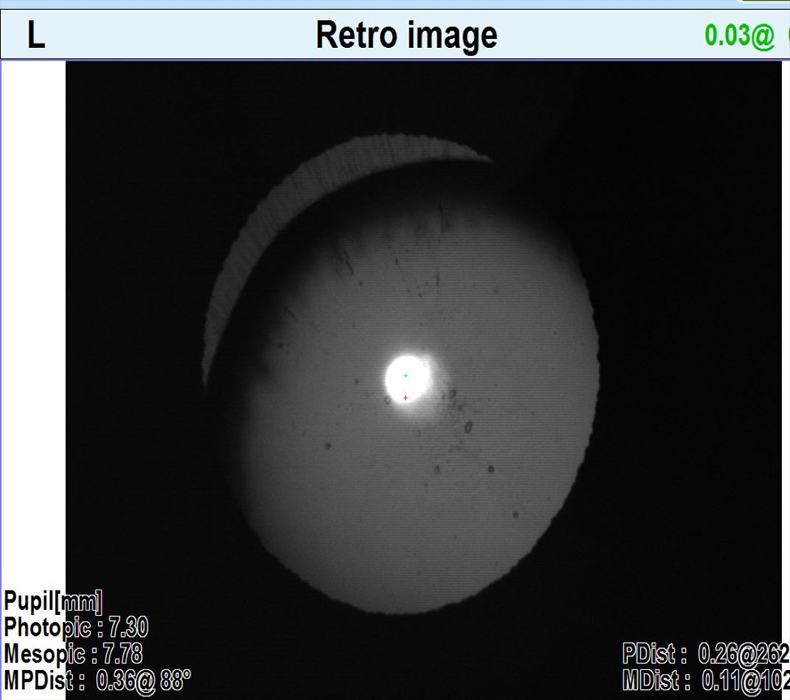
Figure 3. Retroillumination image OS shows subluxation of the crystalline lens.
Diagnostic trial contact lenses were ordered for the patient: CooperVision Hydrasoft toric lenses with a base curve of 8.9 and diameter of 15.0 mm in both eyes. The contact lens powers ordered were -12.00 -1.75 X 180° OD and -10.00 -1.75 X 140° OS.
The patient returned for a contact lens follow-up appointment 2 weeks later with mild complaints of dryness at the end of the day and moderate discomfort OS. Visual acuities measured with the contact lenses in place were 20/50 OD, improving to 20/40 CDVA with a -1.00 D sphere overrefraction, and 20/25 OS, with a -0.25 D sphere overrefraction providing no improvement in CDVA. The contact lens OD was well centered on the eye with good coverage and 0.5 mm of movement. The contact lens OS was well centered on the eye with good coverage but excessive movement of 1.5 mm, consistent with the patient’s presenting complaint.
New diagnostic trial lenses were ordered, changing only the base curve from 8.9 to 8.6 OD. After more than 1 month of wear with the new contact lenses, the patient’s lens discomfort OS was resolved, with a fit showing less movement at 0.5 mm. The contact lens powers were not changed, as the -1.00 D undercorrection OD provided an early monovision reading effect in the more myopic eye. The patient reported no longer experiencing symptoms of diplopia or glare.
DISCUSSION
Upon examination, this patient had no objective findings to suggest Marfan syndrome. The posterior cataract OD and lens subluxation OS were both likely due to trauma. OPD wavefront analysis with integration of corneal topography, OPD, and internal OPD mapping provided better correlation with the patient’s manifest refraction and subsequent final spectacle and contact lens prescriptions (Figure 4).
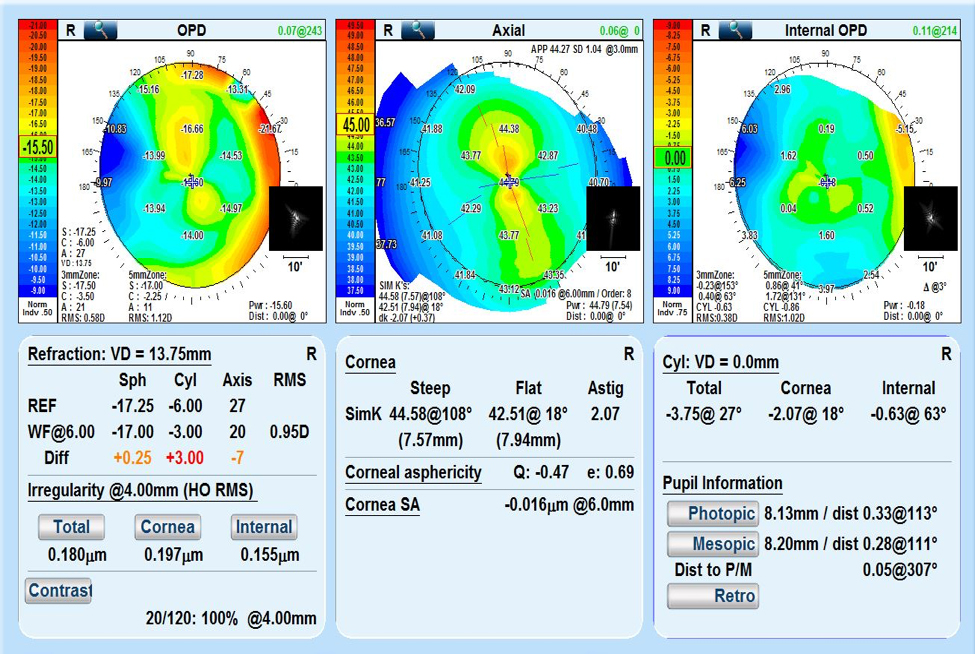
Figure 4. In this optical path difference (OPD) overview analysis of the dilated patient’s right eye, OPD mapping can be correlated with axial or anterior corneal topography. Internal OPD demonstrates the optical pathway measurements from the posterior cornea through to the posterior vitreous. Astigmatism (Cyl: right hand side, center) shows the astigmatic breakdown of total, corneal, and internal components. Thumbnail insets show point spread function images in corresponding areas of the patient’s optical pathway.
Interestingly, the lower amounts of degenerative myopia and astigmatism OD demonstrated by larger diameter wavefront aberrometry correlated more closely with the patient’s final refraction, which eliminated most of the patient’s monocular glare and diplopia. The patient greatly preferred his vision with contact lenses to his vision with glasses.
We instructed the patient to use the contact lenses on a daily wear schedule with a quarterly replacement schedule and to use Optifree PureMoist (Alcon) multipurpose disinfecting solution.
CONCLUSIONS
Eye care analytics, which includes wavefront aberrometry integrated with corneal and internal topographies, tear film analysis, and medical imaging, can provide a more complete analysis of a patient’s optical pathway than traditional objective refractive testing. Understanding a patient’s wavefront analysis in larger diameters than are provided by traditional autorefraction and retinoscopy can afford insights into the patient’s optical system. Analysis of the optical pathway is crucial in understanding patients’ subjective responses and improving their visual outcomes. Modern wavefront analyzers also provide the means of monitoring patients’ refractive error, including astigmatism.
Modern medical imaging has improved the care of glaucoma and refractive surgery patients and of contact lens wearers. It has the potential to solve diagnostic dilemmas and to help manage patients over time through analysis of the optical pathway. It can improve refractive analysis and the diagnosis and treatment of the eye and adnexa. It is important for optometrists and other eye care providers to utilize and develop new technologies such as eye care analytics to improve their patients’ health outcomes.
- Thibos LN. Principles of Hartmann-Shack aberrometry. J Refract Surg. 2000;16(5):S563-565.
- Mrochen M, Kaemmerer M, Mierdel P, Krinke HE, Seiler T. Principles of Tscherning aberrometry. J Refract Surg. 2000;16(5):S570-571.
- Maeda N. Clinical applications of wavefront aberrometry – a review. Clin Exp Ophthalmol. 2009;37(1):118-129.